writing ·
Getting to know the LLAMMA simulator
What we're learning and building around Curve's simulator.
We’ve spent much of yRisk’s first month working with the LLAMMA simulator, a Python tool Curve developed to help choose parameters for LlamaLend markets. Curve has merged four of our contributions, covering accounting fixes, consistent parallel runs, and faster replays (here, here, here, and here). In our ETH, BTC, and LP replay benchmark, our separate compiled build runs about 450× faster per core than the simulator before our changes.
We’re building Parameter Explorer, a web app for orchestrating, inspecting, and sharing simulation runs and their data. Our goal is to build the tooling and frameworks around the simulator to support controlled execution and continuous automated checks of already deployed markets. We’re grateful for the support from Swiss Stake and from Phil, whose tools were a major source of inspiration for our own.
What the simulator is for
LLAMMA handles Curve’s soft liquidations. As a borrower’s collateral falls in price, LLAMMA can gradually trade it into the borrowed asset, such as crvUSD. If prices recover, it can trade back, though the borrower can still lose value through those trades.
The simulator replays price movements to estimate these losses. We can vary A, which controls the spacing of price bands, and the swap fee to compare settings. Loss estimates help inform the loan discount, which limits borrowing against collateral, and the liquidation discount used to assess when a loan can be liquidated. We still need to assess how much collateral could be sold in a liquidation and what could happen outside the simulated history.
Making runs easier to review
We found one source of disagreement in how the simulator split work across processor cores. Parallel runs skipped price adjustments and filtering that single-process runs applied. Our merged fix makes both follow the same steps.
Other differences come from choices reviewers make. Using six months of prices instead of a full year changes the experiment, as does the length and sampling of simulated episodes. Minimizing the worst loss can select different settings from averaging several bad outcomes. Starting positions, trading costs, and oracle settings also need to line up. The oracle provides the market’s reference price.
Parameter Explorer keeps a run’s data, settings, results, and software versions together, so a reviewer can inspect it and reproduce it from a full export without reconstructing the setup from messages. Recording the version matters because accounting and starting-position fixes can move estimated losses in either direction.
Heatmaps and loss charts make patterns across A and fee settings easier to see. We can open one of the worst sampled periods, compare market and oracle price histories, and inspect the oracle’s components. An unexpected price gap can then be traced back to the underlying data and calculations.
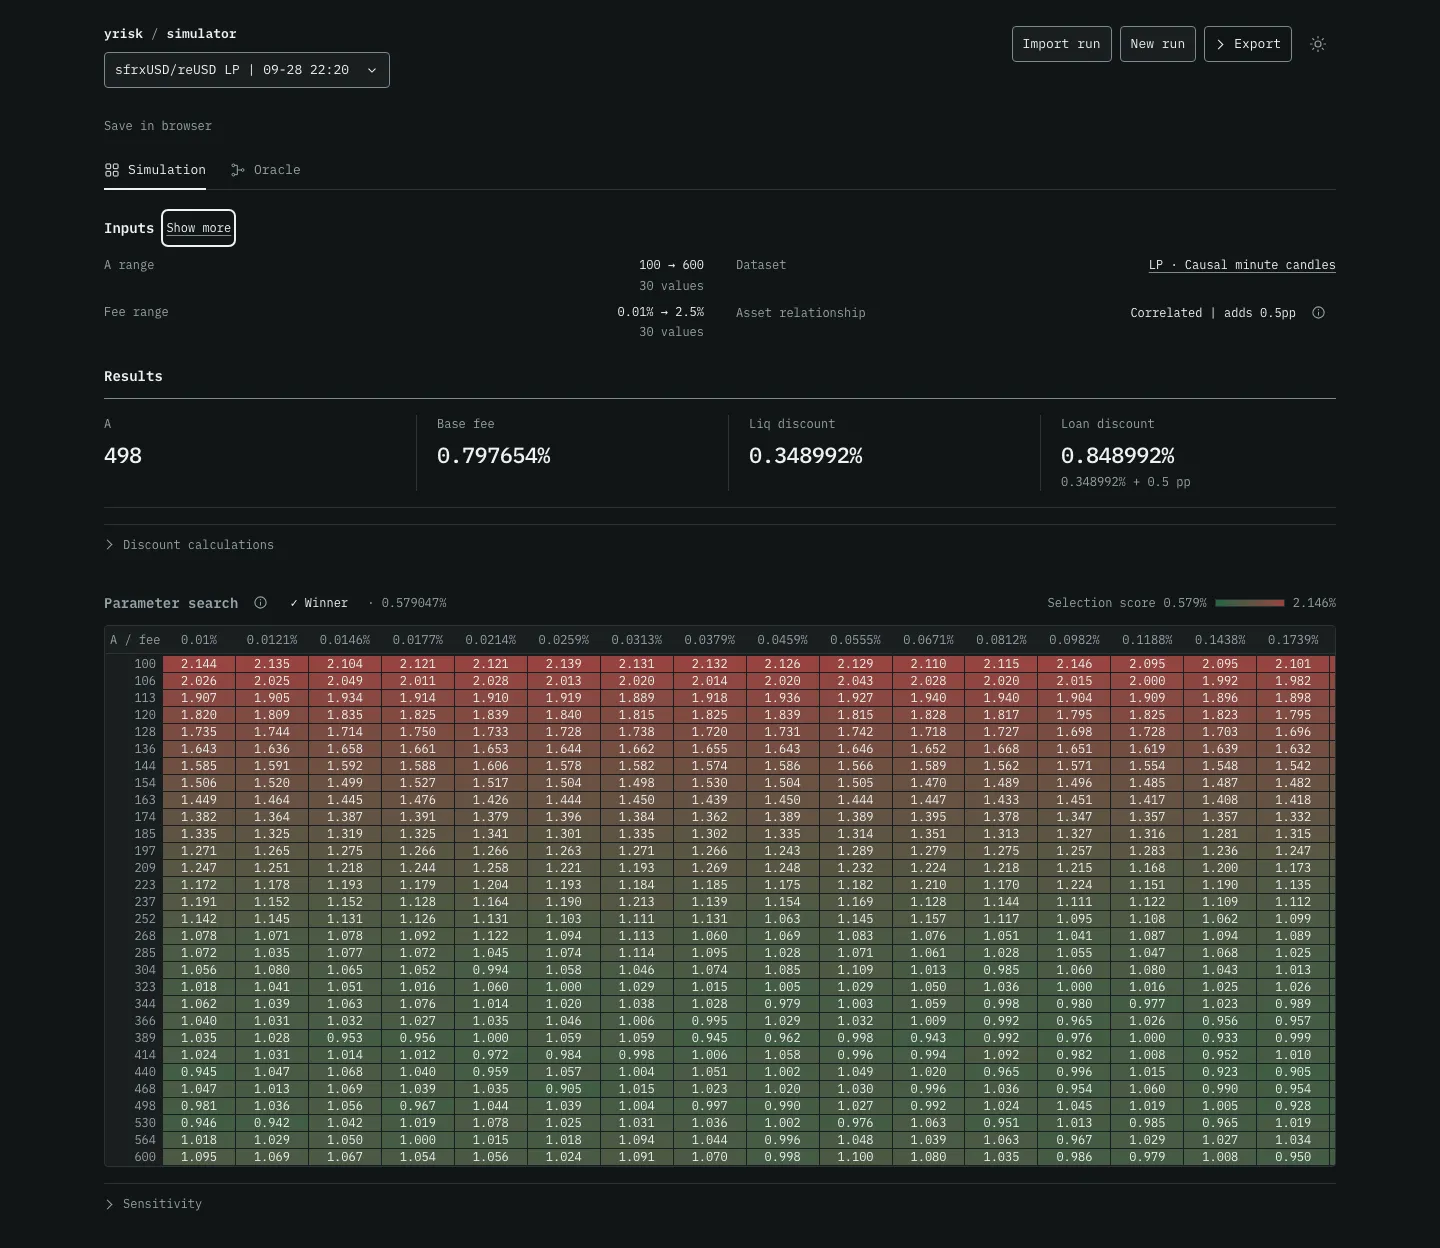
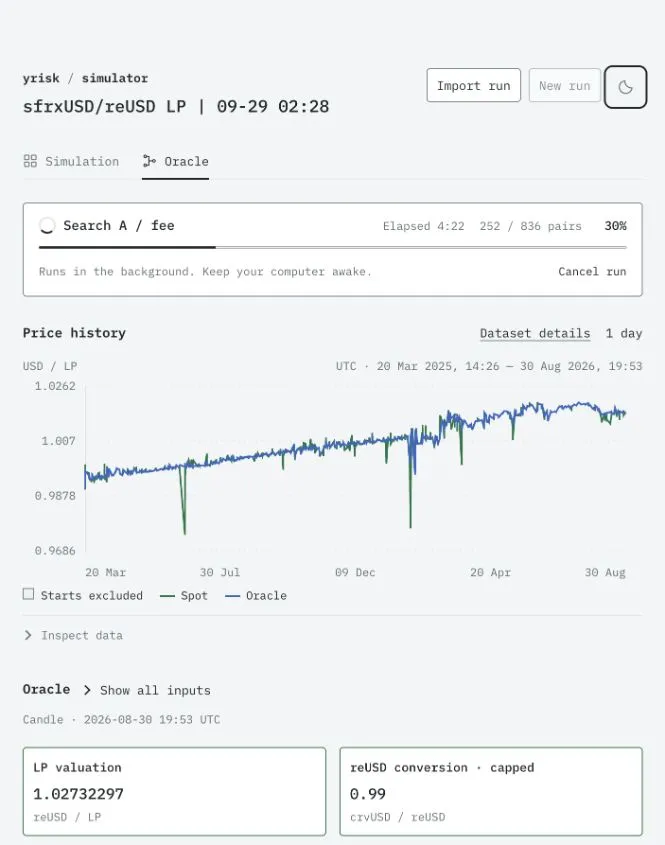
Placeholder screenshots of the sfrxUSD/reUSD LP tooling, captured during separate research runs.
Parameter Explorer currently focuses on the reUSD/sfrxUSD liquidity pool (LP), for which we’ve submitted historical data and preparation steps to Curve. That contribution remains under review. Extending Parameter Explorer to other markets is part of the work ahead.
Why speed matters
Testing a wide range of A and fee combinations can take hours. When the best result lies at the edge of a range, we need to widen it and run again.
Our merged replay improvement speeds up Curve’s Python simulator without changing the losses in our benchmark. For larger sweeps, we’ve also built a separate pipeline that uses Cython to compile a specified version of our Python code into C++. Python remains the source, so improvements can be reviewed and contributed to Curve in the same place. Our further Python improvements remain under review.
Our latest screen tested roughly 2,800 A and fee combinations across 2.8 billion simulated 30-minute windows. The compiled build finishes this in about 35 minutes using eight processor cores. We estimate the same screen would have taken about two weeks on the same eight cores with the simulator as it stood before our changes. That makes broader searches practical and gives us more room to revisit assumptions.
In our replay benchmarks, the latest compiled build runs about 450× faster per core on ETH, BTC, and LP price data sampled every minute, and about 590× faster on block-level reUSD/sfrxUSD LP data. Both comparisons use the simulator before our changes as the baseline. These benchmark figures cover replay calculations, excluding data preparation and startup.
The pipeline records the source and build tools so others can rebuild and check it. Two independent builds produced identical compiled files in the tested environment, and losses matched Python within a preset numerical tolerance.
Keeping deployed markets under review
Systematic follow-up after deployment is a gap we want to close. As prices, liquidity, and borrowing activity change, a market’s original settings may need another look.
Our planned framework will define the data, simulation windows, loss measures, and findings that warrant review. We’ll rerun each market’s active settings against fresh data on a schedule and after material changes, checking whether its loan and liquidation discounts still provide adequate buffers.
A monitoring dashboard will show each market’s latest completed check, data freshness, and issues needing attention. Alerts for materially higher losses will link to the run and price history behind them. Missing data and failed checks will remain visible too.
LlamaLend V2’s configuration controls allow fees, loan and liquidation discounts, and borrow caps to be adjusted after launch. Where the evidence supports a change, we’ll compare alternatives, assess the effect on existing borrowers, and bring a documented recommendation to Curve governance.